Firsthand Technology Opportunities Fund
| Average Annual Total Returns vs. Indices | |||
|---|---|---|---|
| As of MARCH 31, 2026 | |||
| Period | Firsthand Technology Opportunities Fund |
NASDAQ Composite Index | S&P 500 Index |
| Since inception (9/30/99) | 1.04% | 9.09% | 8.30% |
| 10-Year | 3.98% | 17.10% | 14.16% |
| 5-Year | -19.61% | 11.08% | 12.06% |
| 3-Year | -5.01% | 21.75% | 18.32% |
| 1-Year | 15.15% | 25.60% | 17.80% |
| Q1'26 (not annualized) | -15.04% | -6.96% | -4.33% |
| Monthly Performance Update | |||
|---|---|---|---|
| As of MAY 31, 2026 | |||
| Period | Firsthand Technology Opportunities Fund |
||
| Since inception (9/30/99) | 2.50% | ||
| 10-Year | 7.79% | ||
| 5-Year | -13.28% | ||
| 3-Year | 11.21% | ||
| 1-Year | 39.86% | ||
| 1-Month | 19.46% | ||
The Fund's performance information assumes reinvestment of all dividends and includes all Fund expenses, but does not reflect the impact of taxes. Performance data quoted represent past performance, which is not a guarantee of future results, and current performance may be lower or higher than the performance quoted. Both the return from and the principal value of an investment in the Fund will fluctuate so that any investor's shares, when redeemed, may be worth more or less than their original cost. To obtain performance as of the most recent month-end, please contact Firsthand Funds by calling 1.888.884.2675 or go to www.firsthandfunds.com.
The Fund's total gross operating expenses are 1.87%. The Fund's total net operating expenses are 1.85%. Under the Investment Advisory Agreements, the Investment Adviser has agreed to reduce its fees and/or make expense reimbursements so that the Fund's total operating expenses (excluding independent trustees' compensation, brokerage and commission expenses, litigation costs and any extraordinary and non-recurring expenses) are limited to 1.85% of the Fund's average daily net assets up to $200 million, 1.80% of such assets from $200 million to $500 million, 1.75% of such assets from $500 million to $1 billion, and 1.70% of such assets in excess of $1 billion. The current expense waiver is in effect until 4/30/27.
Growth of a Hypothetical $10,000 Investment
September 30, 1999 through March 31, 2026
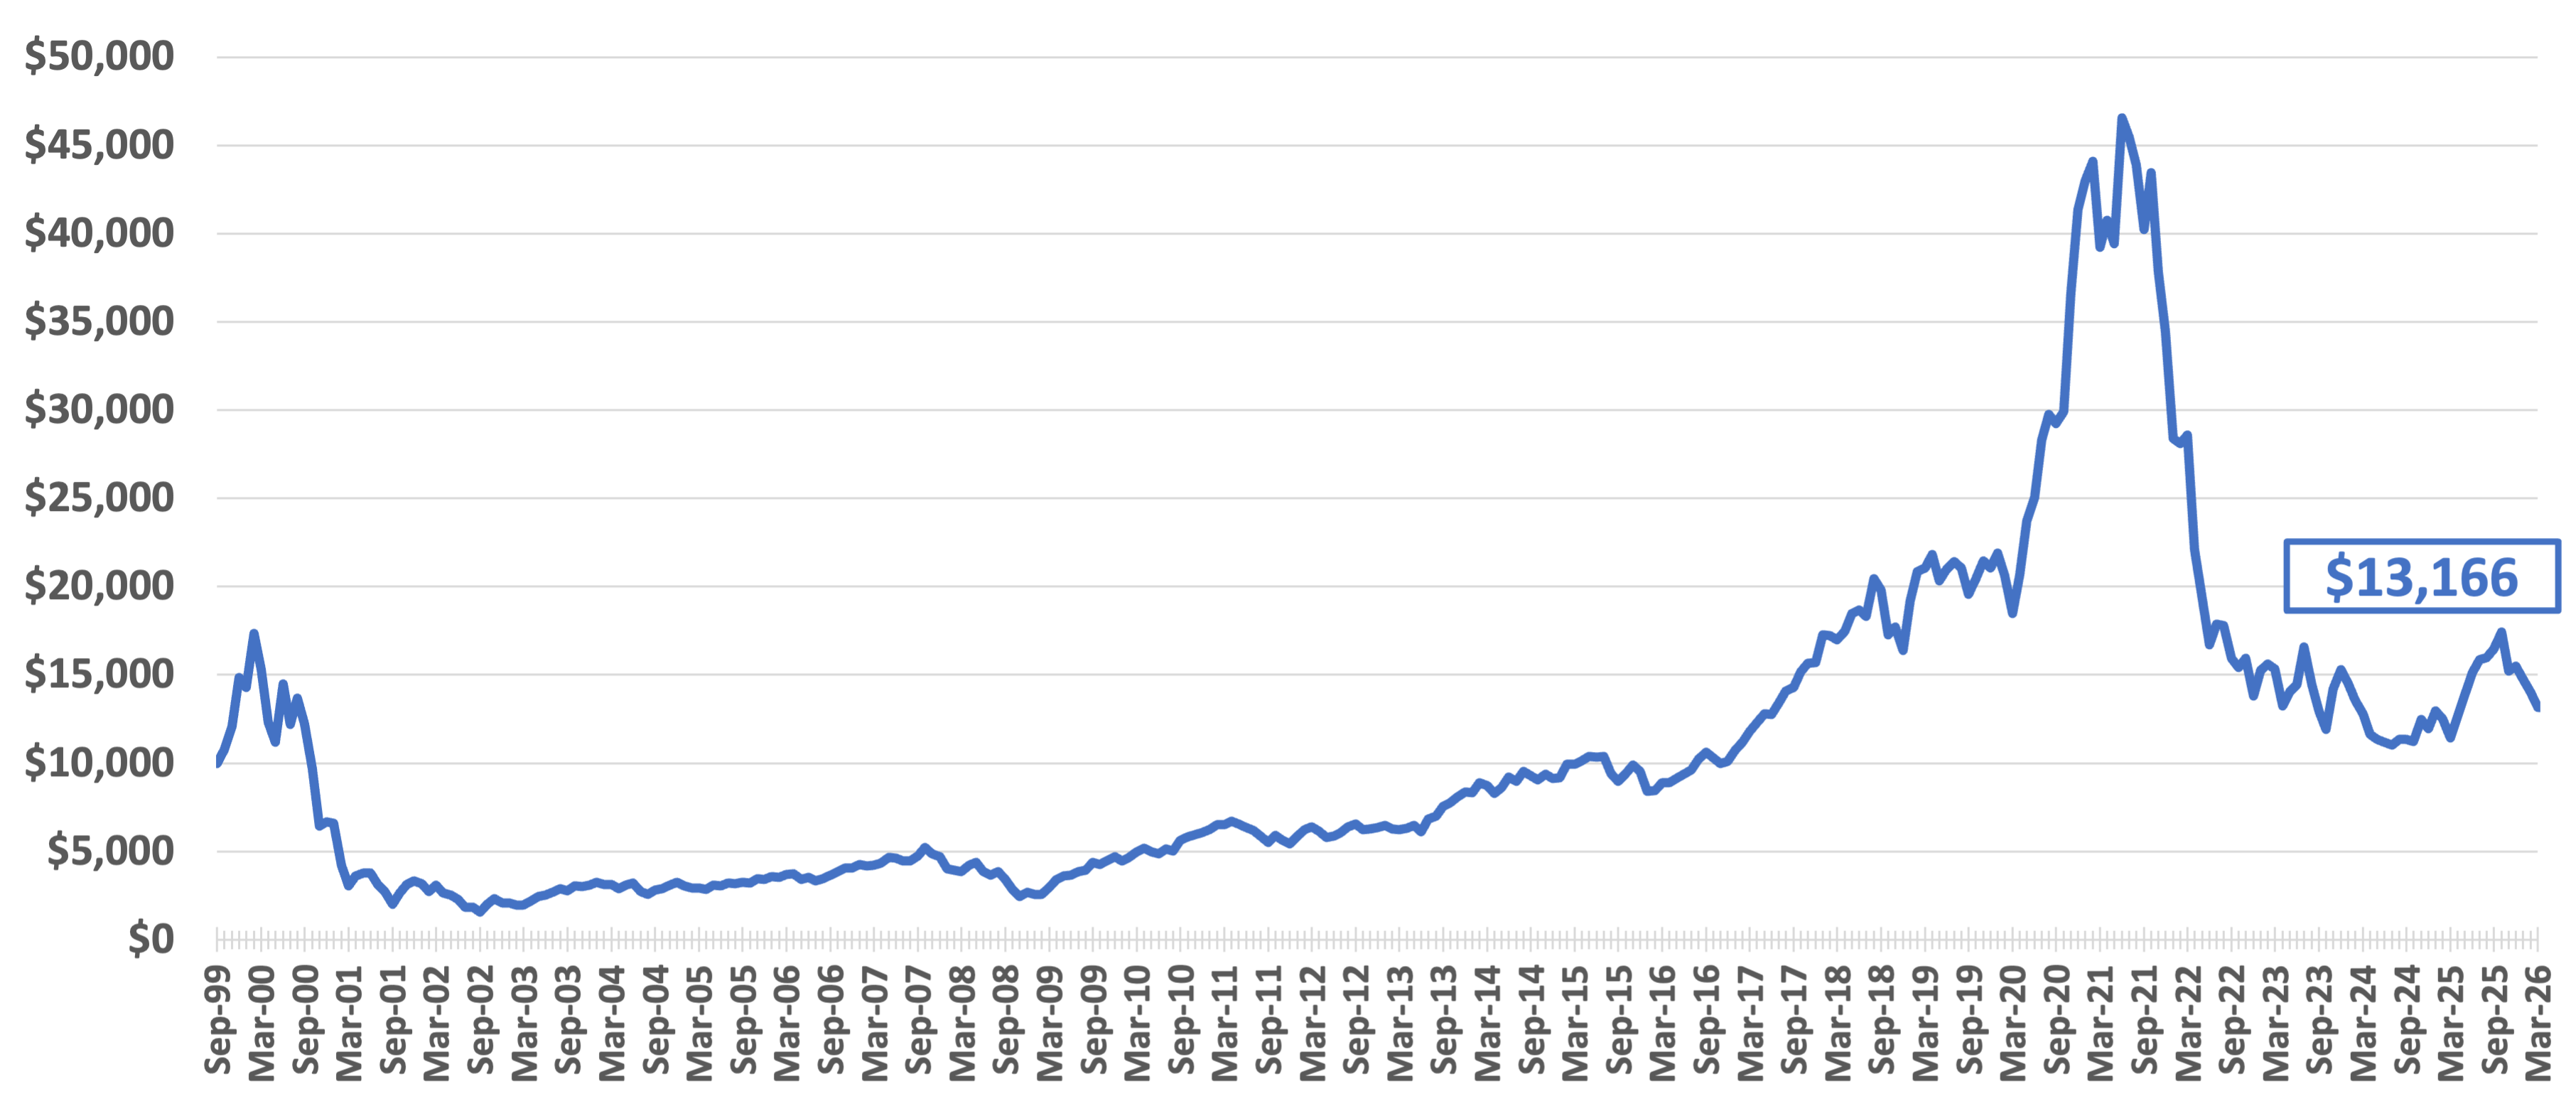
Chart represents the growth of a hypothetical $10,000 investment from Firsthand Technology Opportunities Fund inception date until the end of the quarter indicated. Firsthand Technology Opportunities Fund performance assumes reinvestment of all dividends and includes all Firsthand Technology Opportunities Fund expenses but does not reflect the impact of taxes.
Q1'26 Contributors to Performance
Coherent (COHR) is a manufacturer of lasers and optical networking components and was the largest contributor to the Fund’s performance in Q1. During the quarter, it was announced that Coherent would be added to the S&P 500 Index, effective March 23. The company’s stock was up 29% for the quarter.
Semiconductor equipment provider ASM International (ASMIY) reported strong order growth for the fourth quarter of 2025, relative to the same quarter a year ago. The company also reported record revenues for fiscal 2025, on the back of strong demand from its advanced logic and foundry customers.
Netflix (NFLX) was the third largest contributor to the Fund’s performance in Q1. The streaming company’s stock slumped in the first half of the quarter after narrowly beating analysts’ expectations for Q4 revenues and earnings. The stock surged in late February after the company announced it was dropping its bid to acquire Warner Bros. Discovery.
Q1'26 Detractors from Performance
Shares of Domo (DOMO) declined through much of Q1 as fears of the impact of artificial intelligence (AI) on enterprise software stocks permeated the market. The business intelligence software company’s stock rebounded modestly around the time of its Q4 earnings announcement in early March, but finished the quarter down 64%.
Roku (ROKU) was the second largest detractor from fund performance in Q1. The streaming technology company’s stock declined 13% during the quarter, despite rallying after reporting its Q4 earnings in mid-February.
Shares of MongoDB (MDB) fell sharply in early March, after the company reported its financial results for its fiscal fourth quarter. While revenues exceeded the consensus forecast, the company’s forward guidance of continued operating losses in 2026 disappointed investors.
Firsthand Technology Opportunities Fund is subject to greater risk than more diversified funds because of its investments in fewer securities and because of its concentration of investments in certain industries in the technology sector. Specific risks associated with investments in the technology industries (as described in the Fund's Prospectus) could cause the Fund's share price to fluctuate dramatically. The Fund's investments in small-cap companies present greater risk than investments in larger companies. The Fund invests in several industries within the technology sector and the relative weightings of these industries in the Fund's portfolio may change at any time. Equity investing involves risks, including the potential loss of the principal amount invested.
The NASDAQ Composite Index (NASDAQ) and the Standard & Poor's 500 Index (S&P 500) each represent an unmanaged, broad-based basket of stocks and are typically used as benchmarks for overall market performance. The indices' performance figures assume the reinvestment of all dividends (except where noted), but do not reflect the impact of taxes. Additionally, because an investor cannot invest in an index directly, indices' performance figures do not reflect the expenses associated with the management of an actual mutual fund portfolio.
As of 3/31/26: COHR (5.8% of TEFQX), ASMIY (4.6% of TEFQX), NFLX (9.3% of TEFQX), DOMO (1.8% of TEFQX), ROKU (16.0% of TEFQX), MDB (3.0% of TEFQX).
The information provided should not be considered a recommendation to purchase or sell a particular security and there is no assurance that, as of the date of publication, the securities purchased remain in a Fund's portfolio or that securities sold have not been repurchased. Also, you should note that the securities discussed, even if they have been purchased by a Fund, do not represent a Fund's entire portfolio and, in the aggregate, may represent only a small percentage of that Fund's holdings. There can be no assurance that any Firsthand Funds will buy, sell, or hold any particular security after the date referred to in the discussion.